Crunching The Numbers: The Maritime Silk Road Trade Index In March & Q1 2020
China’s Global Import/Export Trade Data March 2020
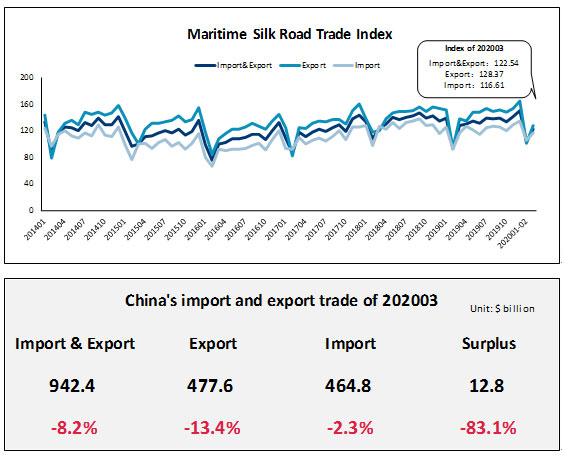
In March 2020, the Maritime Silk Road Trade Index (STI) showed that China’s overall import and export trade for the month was down 3.92% year-on-year. This comprised export trade being down 6.81% year-on-year; and import trade down 0.47% year-on-year.
In terms of quarterly data, in Q1 this year, China’s total import and export trade was US$942.39 billion, down 8.24% year-on-year. The total export trade was US$477.59 billion, down 13.40% year-on-year; total import trade was US$464.79 billion, down 2.27% year-on-year; the trade surplus was US$12.803 billion, narrowing by 83.13%.
The Maritime Silk Road Trade Index is produced by the Ningbo Shipping Exchange.
China’s Q1 Continental Trade
Asia
In the first quarter, the import and export trade value between China and Asia was US$502.7 billion, a year-on-year decrease of 4.62%, accounting for 53.34% of China’s total imports and exports. The export trade value was US$246.92 billion, down 8.53% year-on-year; while import trade was US$255.78 billion, down 0.52% year-on-year.
Europe
The import and export trade value between China and Europe was US$179.47 billion, down 10.28% year-on-year, accounting for 19.04% of China’s total import and export value. The export trade volume was US93.67 billion, down 16.95% year-on-year; and import trade volume was US$85.79 billion, down 1.66% year-on-year.
Africa
The import and export trade value between China and Africa was US$41.25 billion, a year-on-year decrease of 13.27%, accounting for 4.38% of China’s total imports and exports. The export trade value was US$ 214.29 billion, down 10.50% year-on-year; the import trade value was US$19.823 billion, down 16.08% year-on-year.
North America
The import and export trade value between China and North America was US$106.78 billion, down 21.30% year-on-year, and accounting for 11.33% of China’s total imports and exports. Export trade value was US$74.45 billion, down 25.17% year-on-year; the import trade value was US$32.33 billion, down 10.64% year-on-year.
Latin America
The import and export trade value between China and Latin America was US$68.41 billion, down 5.05% year-on-year, accounting for 7.26% of China’s total imports and exports. The export trade value was US$29.54 billion, down 8.23% year-on-year; while import trade value was US$38.86 billion, down 2.47% year-on-year; the trade surplus was US$9.316 billion, up 21.80% year-on-year.
Oceania
The import and export trade value between China and Oceania was US$43.65 billion, down 1.59% year-on-year, and accounting for 4.63% of China’s total imports and exports. The export trade value was US$11.565 billion, down 11.68% year-on-year; with import trade volumes reaching US$32.007 billion, up 2.64% year-on-year.
We are grateful to the Ningbo Shipping Exchange for providing these statistics.
Related Reading
- The Maritime Silk Road Trade Index China Trade Down In Nearly All Regions Due To Covid-19
- China’s Maritime Belt Road Free Trade Agreements In South Asia
About Us
Silk Road Briefing is written by Dezan Shira & Associates. The firm provides strategic analysis, legal, tax and operational advisory services across Eurasia and has done since 1992. We maintain 28 offices throughout the region and assist foreign governments and MNC’s develop regional strategies in addition to foreign investment advice for investors throughout Asia. Please contact us at asia@dezshira.com or visit us at www.dezshira.com